Analytics helps you understand what is working after content publishes. Use workspace, account, and post-level data to improve manual posts, brief Pim more clearly, and make future Plans more focused.
Workspace Analytics
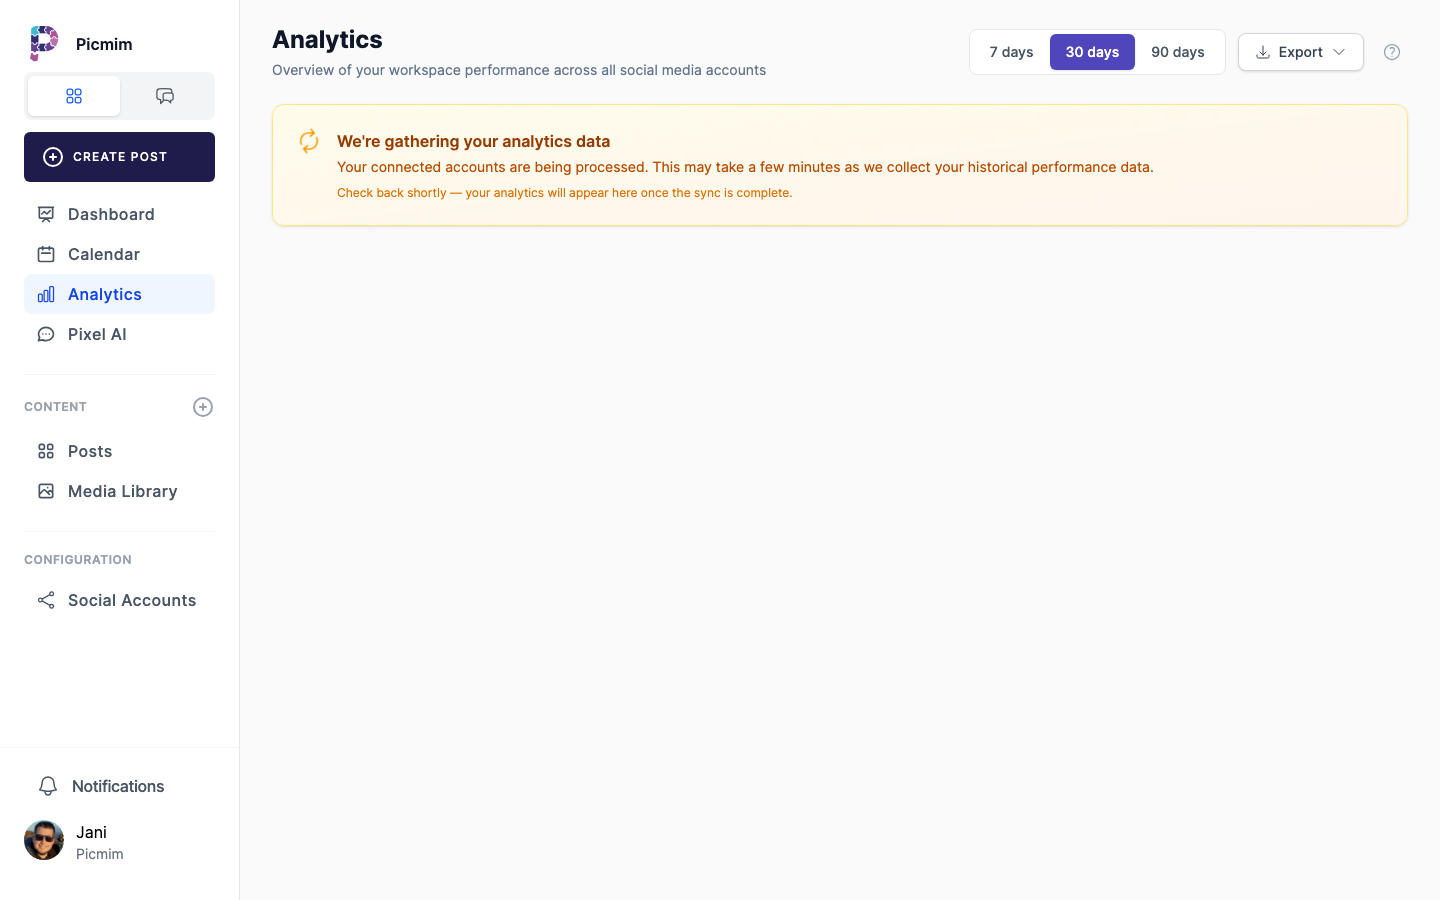
Workspace analytics summarize activity and performance across connected accounts. Use this view when you need the broad health of a brand, client, or workspace.
- Open Analytics from the workspace sidebar.
- Review all-time totals such as connected accounts, followers, and published posts where available.
- Select a time period to inspect reach, impressions, engagement, follower growth, and other supported metrics.
- Compare recent results with the previous period when comparison data is available.
- Use high-level trends to decide what your next Plan should emphasize.
Tip: Use a longer period for strategy and a shorter period for campaign troubleshooting.
Account-Level Analytics
Account analytics show how each connected profile, page, or channel is performing. Availability depends on the platform and account type.
- Switch to the account view in Analytics.
- Select the account or accounts you want to compare.
- Review follower, reach, impression, engagement, click, video, and profile metrics where available.
- Look for accounts that need different posting frequency, formats, or topics.
- Use the findings when choosing channels for the next Plan.
Platform Availability and Limits
Social platforms do not expose the same analytics fields. Picmim shows supported data and leaves unavailable metrics out rather than inventing numbers.
- LinkedIn Company Pages usually expose richer reporting than personal LinkedIn profiles.
- Instagram metrics depend on account type, connection method, and what Instagram exposes for the content format.
- Stories, Reels, videos, documents, and photo posts can have different metric availability.
- If a metric is missing, check account permissions, platform support, and connection health.
Post-Level Analytics
Post analytics help you identify which topics, formats, hooks, captions, and publish times earned the strongest response.
- Open the Posts view in Analytics.
- Sort or filter by platform, post type, period, or performance metric.
- Open individual posts to inspect available metric breakdowns.
- Compare Plan-generated posts and manual posts by theme, format, and outcome.
- Use the strongest examples as source context for future Plans or templates.
Period Selector
Change the analytics period to match the question you are answering. A campaign review may need different dates than weekly monitoring.
- Use preset periods such as 7 days, 30 days, or 90 days where available.
- Choose a custom date range for launches, offers, events, or client reports.
- Compare with the previous period when Picmim shows comparison deltas.
- Make sure the selected dates include the posts you want to analyze.
Metric definitions
Each number on the Analytics pages means the same thing wherever it appears. Period figures cover the dates you select; changes compare them with the period of the same length just before.
- Followers: People following your connected profiles right now, added up across profiles.
- Total posts: Every post we track on your connected profiles, whether published with Picmim or directly on the platform.
- Posts: Posts published in this period, whether with Picmim or directly on the platform.
- Views: How many times your posts were shown on screen, counting repeat views by the same person. LinkedIn and Pinterest call these impressions.
- Reach: How many different people saw your posts at least once.
- Engagement: Likes, comments and shares on your posts.
- Engagement rate: Engagement as a share of the people who saw each post, averaged across posts. Changes are shown in percentage points (pp).
- Followers gained: New followers minus people who unfollowed during this period.
- Performance: How a post did compared with your other posts on this profile, from 0 to 100. It weighs engagement rate, views and engagement. 70 or more is better than usual; under 30 is below usual.
- Likes: Likes and reactions on your posts.
- Comments: Comments people left on your posts.
- Shares: Times people shared or reposted your posts.
- Saves: Times people saved your posts to come back to later.
- Story views: Views of your Stories in this period.
- Profile visits: Visits to your profile, as last reported by the platform.
- Website clicks: Taps on the website link on your profile or posts.
- Video views: Times your videos were played.
Tip: The performance bands mean: better than usual (score 70 or more), typical (30 to 69) and below usual (under 30), always compared with the same profile’s own posts.
Benchmarks and Better Briefs
Benchmarks help you turn performance into better creative direction. Use what worked as input for Pim instead of starting the next Plan from a blank brief.
- Identify top-performing posts by engagement, reach, clicks, saves, or another goal metric.
- Look for repeated patterns in hook, format, offer, topic, visual style, or timing.
- Mention those patterns in the next Plan brief.
- Avoid overfitting to one post; look for repeatable signals across several examples.
Tip: Ask Pim to create more posts like your strongest examples, then describe exactly what made those examples useful.
Best Time to Post
Timing insights can help manual schedules and Plans land closer to moments when your audience is active.
- Review timing data in Analytics when enough history is available.
- Look for days and hours with stronger engagement or reach.
- Use those windows when scheduling manual posts.
- Give Pim a timeframe in Plans so the generated schedule can spread content across useful days.
Charts and Trends
Charts make it easier to see whether performance is improving, declining, or changing by content type.
- Review follower, reach, impression, engagement, and content performance charts where available.
- Hover or open chart details for exact values and dates.
- Watch for spikes that line up with campaigns, offers, collaborations, or paid activity.
- Use trends as direction for future Plans rather than copying one post blindly.
Exporting Reports
Exports help when you need to share results with teammates, clients, finance, or external reporting tools.
- Choose the account, metric set, and date range you need.
- Use Export when the Analytics page offers it.
- Download CSV or another supported format.
- Review the exported file before sending it to stakeholders.
Tip: Keep export dates consistent if you report month over month or quarter over quarter.
Facebook, Instagram, and Meta Notes
Facebook and Instagram can occasionally return unclear messages for deleted content, changed permissions, boosted posts, or temporary rate limits. Picmim explains the common cases where possible and keeps enough support detail to help investigate repeated issues.
- Reconnect the account when permissions changed or insights stopped updating.
- Accept requested permissions when reconnecting if you need both organic and paid metrics.
- Deleted or hidden content may stop returning analytics from the platform.
- Rate limits are usually temporary; retry later if sync is throttled.
- Share the support details shown in Picmim when you contact support about a repeated analytics issue.
Tip: When in doubt, refresh permissions for the affected Facebook or Instagram account before opening a support ticket.